
Content
- Introduction
- Installation of the sensor
- Code preparation
- Data collection and preprocessing
- Model training and inference
Introduction
In this tutorial, we will install and use an environmental sensor in Jetson Nano. The environmental sensor collects information including temperature, humidity, air pressure, ambient VOC, IR light intensity, and so on. These data are generated in time scale, for which we can put them in a table. For example,
| Time / Attribute | Temperature (Celsius degree) | Humidity (RH) |
|---|---|---|
| 0 | 10 | 80.2 |
| 1 | 9.8 | 80.4 |
| 2 | 9.9 | 80.2 |
| 3 | 10 | 80 |
Since they are time-series data, we can use logistic regression to predict the values we want. For example, use temperature to predict humidity.
Sensor Installation
Align the 40-pin connectors between Jetson Nano and the sensor:
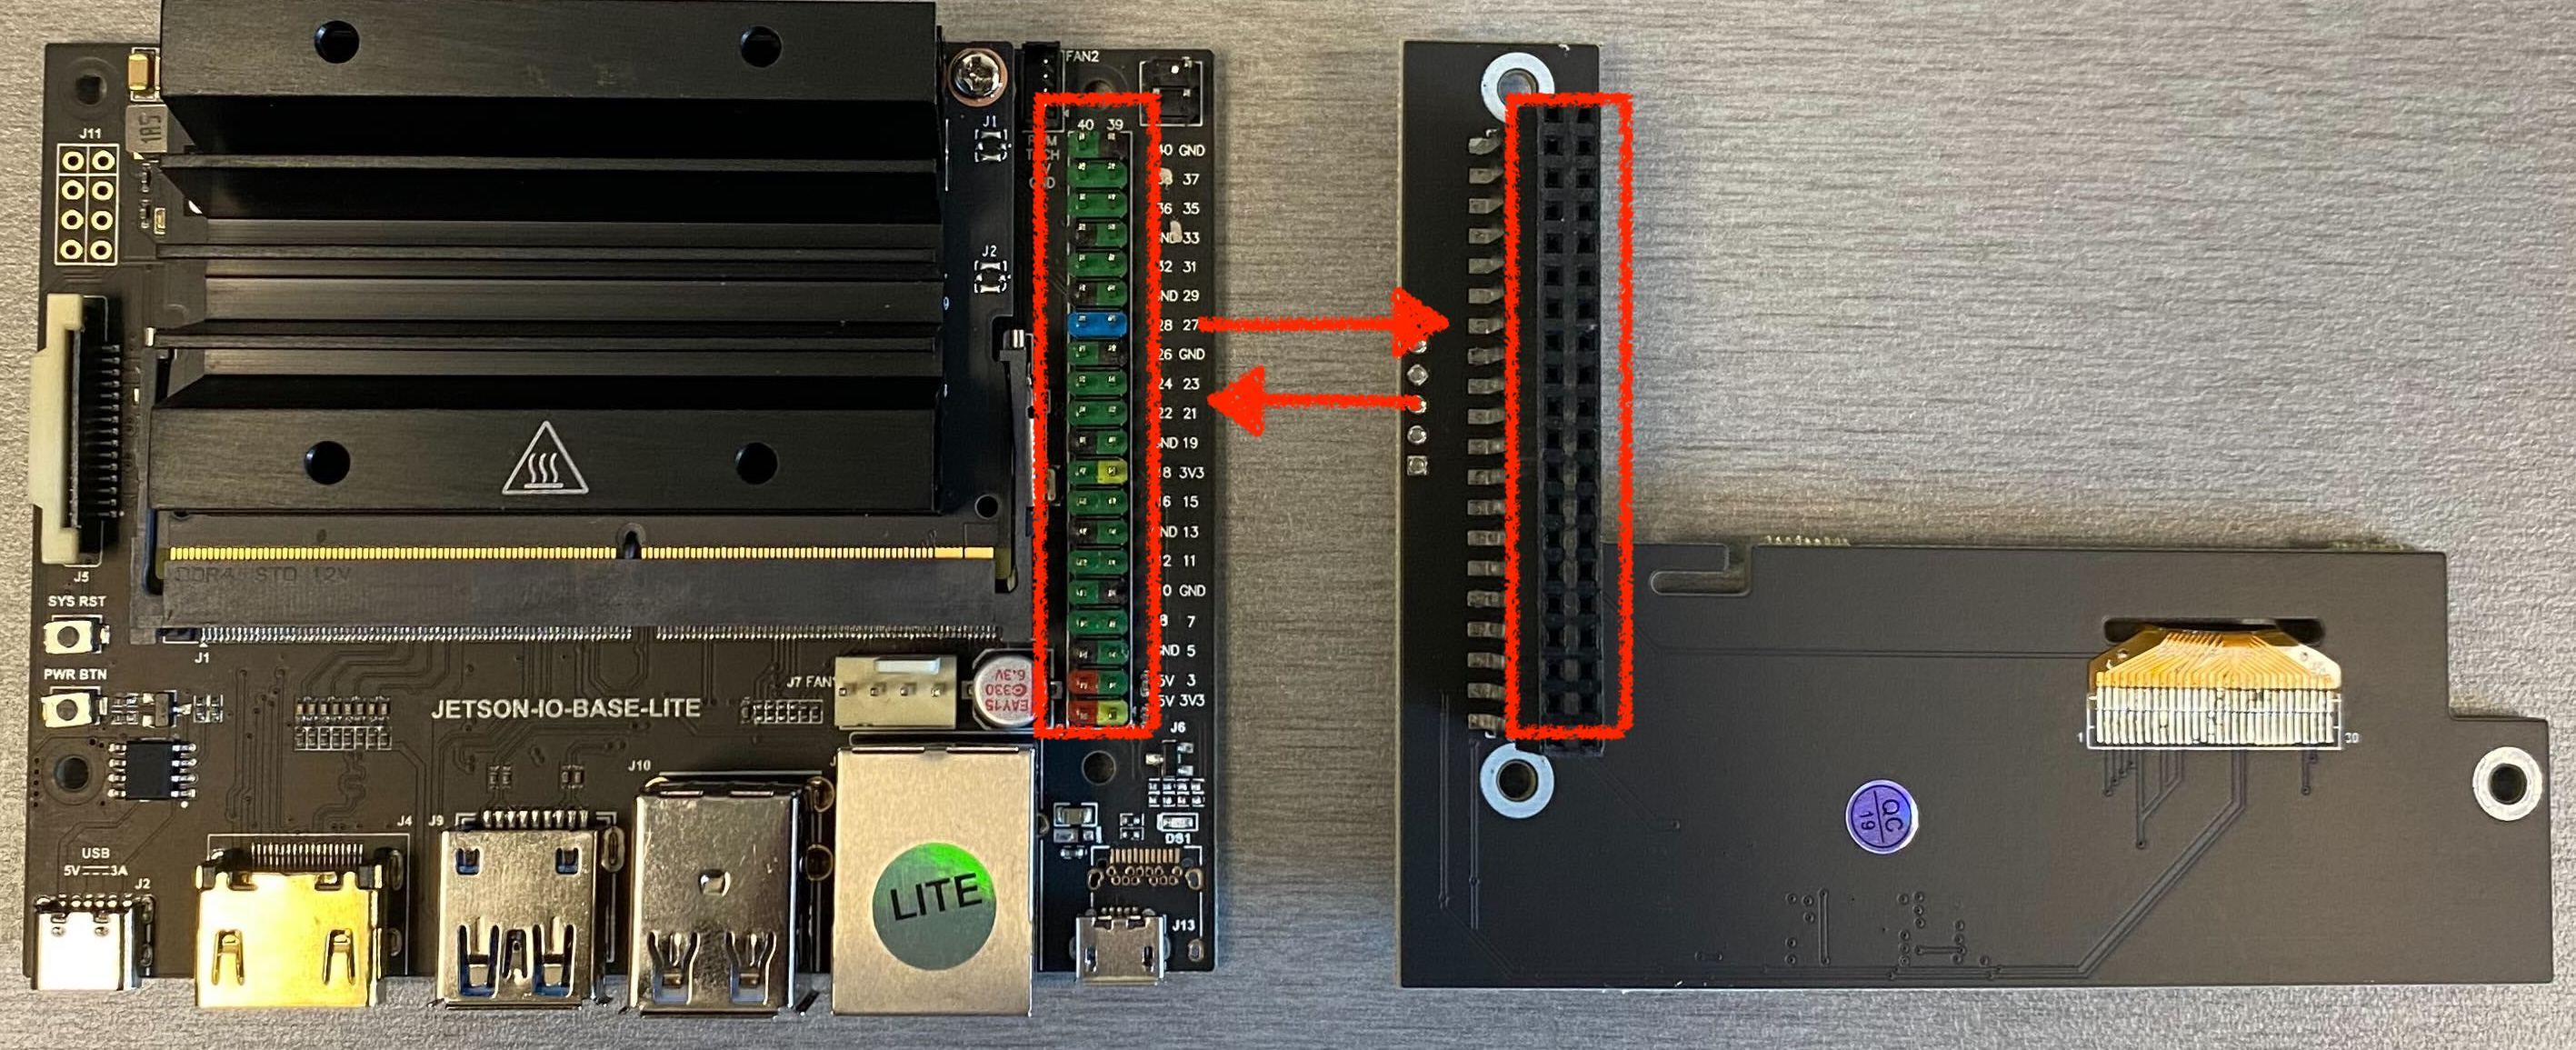 Environmental sensor installation
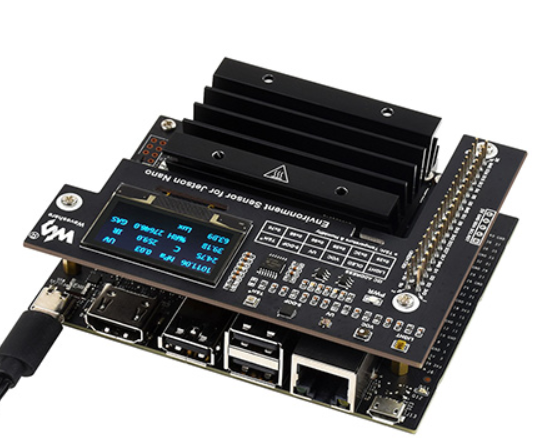 Environmental sensor installed on Jetson Nano
Code Preparation
Install dependencies
1
2
3
4
sudo apt-get install python-smbus
sudo -H apt-get install python-pil
sudo apt-get install i2c-tools
sudo apt-get install python3-tk
Download the data collection package:
1
2
3
sudo apt-get install p7zip-full
wget https://files.waveshare.com/upload/f/f5/Environment_sensor_fot_jetson_nano_rev3.zip
7z x Environment_sensor_fot_jetson_nano.7z  -r -o./Environment_sensor_fot_jetson_nano
Test the package
1
2
cd Environment_sensor_fot_jetson_nano
sudo python test.py
If everything is done, the screen will visualize the sensor outputs: 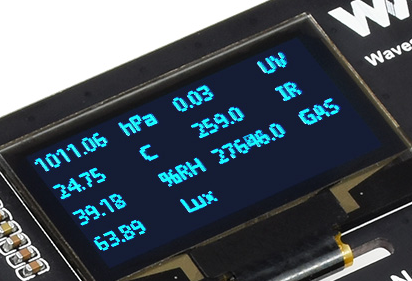 Sensor outputs on the screen
test.py visualizes all sensor outputs. There are other scripts for a single reading of the sensor signal:
| Sensor | Script | Note |
|---|---|---|
| Ambient light Sensor | TSL2591.py | |
| Temperature and Humidity Sensor | BME280.py | |
| 9-AXIS Sensor | ICM20948.py | |
| IR/UV Sensor | LTR390.py | |
| VOC Sensor | SGP40.py | 0 to 1,000 ppm ethanol equivalent |
Take a closer look at the sensor reading parts of the test.py:
1
2
3
4
5
6
7
8
9
10
11
12
13
14
15
16
17
18
19
20
21
22
23
24
25
26
27
28
29
30
31
32
33
34
35
36
37
38
39
40
41
42
43
44
45
46
47
48
49
50
51
52
53
54
55
56
57
58
59
60
61
62
63
64
65
66
67
68
69
70
71
72
73
74
75
76
77
#!/usr/bin/python
# -*- coding:utf-8 -*-
import time
import SH1106 #OLED
import MPU9255 #Gyroscope/Acceleration/Magnetometer
import BME280   #Atmospheric Pressure/Temperature and humidity
import LTR390   #UV
import TSL2591  #LIGHT
import SGP40
import math
import os

os.system('i2cdetect -y -r 1')
# time.sleep(1)

# initiate sensor readers
bme280 = BME280.BME280()
bme280.get_calib_param()
print("bme280 T&H I2C address:0X76")
light = TSL2591.TSL2591()
print("TSL2591 Light I2C address:0X29")
uv = LTR390.LTR390()
print("UV I2C address:0x60")
sgp = SGP40.SGP40()
print("SGP40 VOC I2C address:0X59")
MPU9255 = MPU9255.MPU9255()
print("MPU9255 9-DOF I2C address:0X68")
oled = SH1106.SH1106()
print("OLED I2C address:0x3c")

# Initiate empty data containers


try:
  print("Comprehensive test program...")
  print("please Enter ctrl+c to end program")


  while True:
    time.sleep(0.2) # stop for 0.2 sec before every reading
    bme = []
    bme = bme280.readData()
    pressure = round(bme[0], 2)
    temp = round(bme[1], 2)
    hum = round(bme[2], 2)

    print(f"pressure {pressure} kPa")
    print(f"temperature {temp} Celsius degree")
    print(f"humidity {hum} rh")

    lux = round(light.Lux(), 2)

    print(f"lux {lux}")

    uvdata = uv.UVS()
    uv = round(uv.UVS(), 2)
    ir = round(uv.readdata()[1], 2)

    print(f"uv {uvdata}")
    print(f"ir {ir}")

    gas = round(sgp.raw(), 2)

    print(f"gas {gas}")

    icm = []
    icm = MPU9255.getdata()
    roll = round(icm[0], 2)
    pitch = round(icm[1], 2)
    yaw = round(icm[2], 2)

    print(f"motion data: roll {roll}, pitch {pitch}, yaw {yaw}")

except KeyboardInterrupt:
  print("exit")
Data Collection and Preprocessing
Data collection
We take the BME280 sensor as an example to collect temperature, humidity, and pressure data. Note that we are using python2 here.
1
2
3
4
5
6
7
8
9
10
11
12
13
14
15
16
17
18
19
20
21
22
23
24
25
26
27
28
29
30
31
32
33
34
35
36
37
38
39
40
41
42
43
#!/usr/bin/python
# -*- coding:utf-8 -*-
import time
import BME280   #Atmospheric Pressure/Temperature and humidity
import pickle

# initiate sensor readers
bme280 = BME280.BME280()
bme280.get_calib_param()
print("bme280 T&H I2C address:0X76")

# initiate the data container as dictionary
data = {'humidity':[], 'temperature':[], 'pressure':[]}


# Record a 5-second data
duration = 5
start_time = time.time()
current_time = time.time()

while current_time - start_time < 5:

  # read sensor data
  time.sleep(0.2) # stop for 0.2 sec before every reading
  bme = []
  bme = bme280.readData()
  pressure = round(bme[0], 2)
  temp = round(bme[1], 2)
  hum = round(bme[2], 2)

  # record the data in dataframe
  data['humidity'].append(hum)
  data['temperature'].append(temp)
  data['pressure'].append(pressure)

  current_time = time.time()

# save dataframe to pickle file
filepath = "./data.pkl"
datafile = open(filepath, 'wb')
pickle.dump(data, datafile)
datafile.close()
Data visualization
We will use matplotlib to visualize the distribution of the collected data.
Activate the virtual environment
1
2
source ./myjetson/bin/activate
pip install matplotlib
1
2
3
4
5
6
7
8
9
10
11
12
13
14
15
16
17
18
19
20
21
22
23
import matplotlib.pyplot as plt
import pickle
import numpy as np

# read pickle data
filepath = "./data.pkl"
datafile = open(filepath, 'rb')
data = pickle.load(datafile)
datafile.close()

temp = np.array(data['temperature'])
hum = np.array(data['humidity'])
pressure = np.array(data['pressure'])

t = np.arange(len(temp))

plt.plot(t, temp, label="temp")
plt.plot(t, hum, label="hum")
plt.plot(t, pressure, label="pressure")

plt.legend()
plt.show()
Model Training and Prediction
Lets train a linear regression model to predict temperature from pressure and humidity.
We will use Linear Regression model from the Scikit-learn package.
split dataset into training and testing
Training
1
2
3
4
5
6
7
8
9
10
11
12
13
14
15
16
17
18
19
20
21
22
23
24
25
26
27
28
29
30
from sklearn.linear_model import LinearRegression
import numpy as np
import pandas as pd

# read pickle data
filepath = "./data.pkl"
datafile = open(filepath, 'rb')
data = pickle.load(datafile)
datafile.close()

temp = np.array(data['temperature'])
hum = np.array(data['humidity'])
pressure = np.array(data['pressure'])

X = np.zeros((2, len(temp)))
X[0] = hum
X[1] = pressure
y = temp

# fit the data
reg = LinearRegression().fit(X, y)

# check the R**2 score
print(reg.score(X, y))

# check coefficient and intercept
print(reg.coef_, reg.intercept_)

#
Reference
sensor wiki https://www.waveshare.com/wiki/Environment_Sensor_for_Jetson_Nano#How_to_use