Content
- Why Graph in ML?
- Classic Graph ML tasks
- Choice of representations
1. Why Graph in ML?
1.1 Graph structure naturally exists in many data
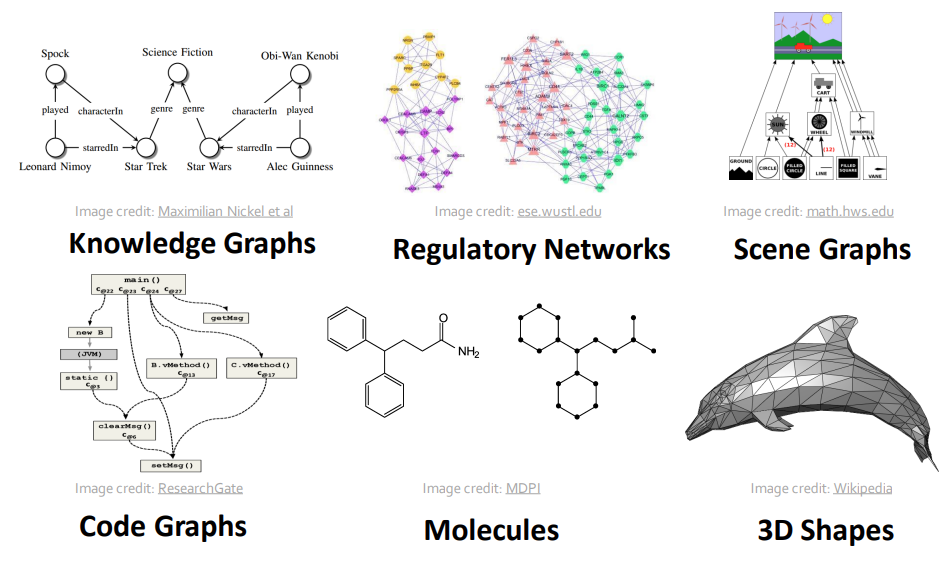 Data examples that can be represented as graph (from lecture 1.1 slide p6)
It is beneficial to predict by explicitly modeling relationships.
1.2 Use Deep Neural Network instead of feature engineering
With the advances in DL, we can input graph structure data into a end-to-end model that automatically learn and extracts useful features for graph ML tasks.
Therefore, a significant focus of graph learning is representation learning.
1.3 Hard to learn from graph
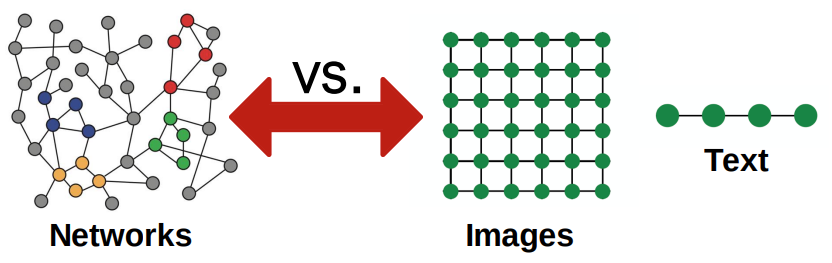 Different data structures (from lecture 1.1 slide)
However, it is also hard to learn from such structure, because:
- topology-structured data like images and text, networks can have arbitary size and complex topological structure.
- no fixed node ordering
- often dynamic and have multimodal features
2. Classic graph ML tasks
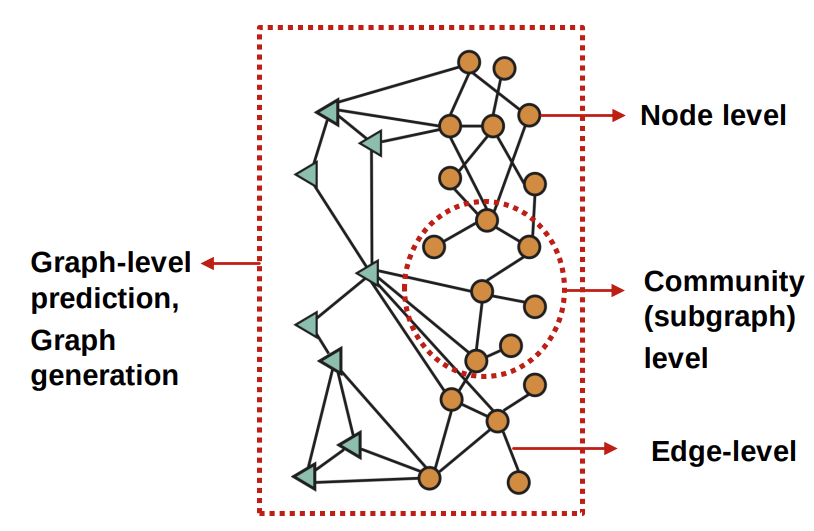 Different tasks(from lecture 1.1 slide)
2.1 graph level
- graph classification: categorize different graphs
- example: molecule property prediction
- graph generation
- example: drug discovery
- problems: antibiiotics are small molecular graphs
- tasks: input drug property, output posssible molecules
- nodes: atoms
- edges: chemical bonds
- solution1: GNN predict promising molecules from a pool of candidates
- example: drug discovery
- graph evolution
- example: physical simulation
- problems: physical simulation as graphs
- tasks: predict material behaviors
- nodes: particles
- edges: interaction between particles
- solutions1: generate proximity graphs, pass messagess, extract dynamics info
 Learning to Simulate Complex Physics with Graph Networks https://arxiv.org/pdf/2002.09405.pdf
- example: physical simulation

2.2 node level
node classification: predict a proterty of a node categorize users/items
2.3 subgraph level
- clustering: detect if nodes form a community
- example1: social circle detection
- example2: traffic prediction
- problem: road network as graph
- nodes: road segments
- edges: conectivity between road segments
- solution1:
2.4 edge level
- link prediction: predict whether there are missing links between two nodes
- example1: knowledge graph completion
- example2: recommendation systems
- problem setting: users interact with items
- nodes: users and items
- edges: user-item interactions
- task: recommend related pins to users
- solution1: to learn node embeddins $z_i$ such that: $ d(z_{cake1},z_{cake2}) < d(z_{cake1},z_{sweater}) $, indicating that related items have smaller “distance” between each other.
3. Choices of representation
graph structure
choices of what to represent nodes and edges are important given a specific domain
3.1 types of graphs
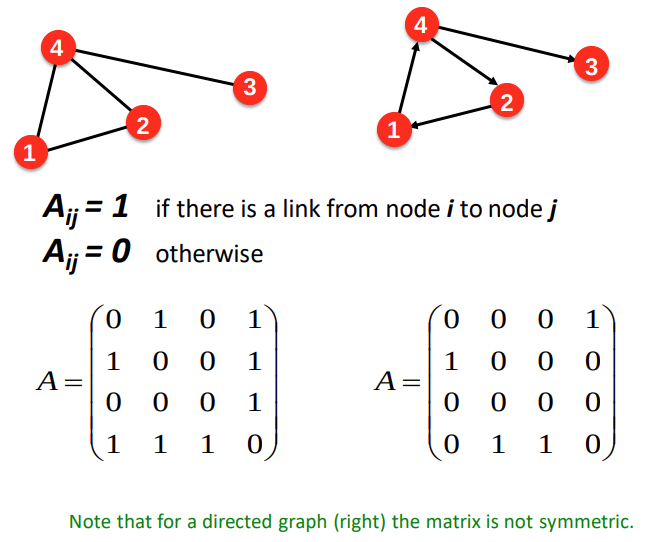
 undirected graph vs directed graph (from lecture 1.3 slide)
- undirected graph (UG): edges are undirected
- node degree: the number of edges adjacent to node i as $k_i$
- average degree: $\bar{k} = \frac{1}{N} \sum {k_i} = \frac{2E}{N}$
- example: Bipartite graph
- user/item
- directed graph (DG): edges are directed
- in degree: the number of in edges adjacent to node i
- out degree: the number of out edges adjacent to node i
- graph representation
- adjacency matrix
- symetric for UG
- may assymetric for DG
- ARE SPARCE MATRICES
- can change the binary value to
- edge list
- (1,2), (3,2), …
- inefficient
- adjacency list
- 1:, 2:3,4, …
- easier if network is large and sparce
 adjacency matrix (from lecture 1.3 slide)
 - adjacency matrix
- node and edge attributes/representation
- hand-crafted attributes
- neural-based features
- graph connectivity of UG